Všechny funkce, co potřebujete
Requestor má spoustu užitečných funkcí. A další na základě vašich potřeb neustále přidáváme.
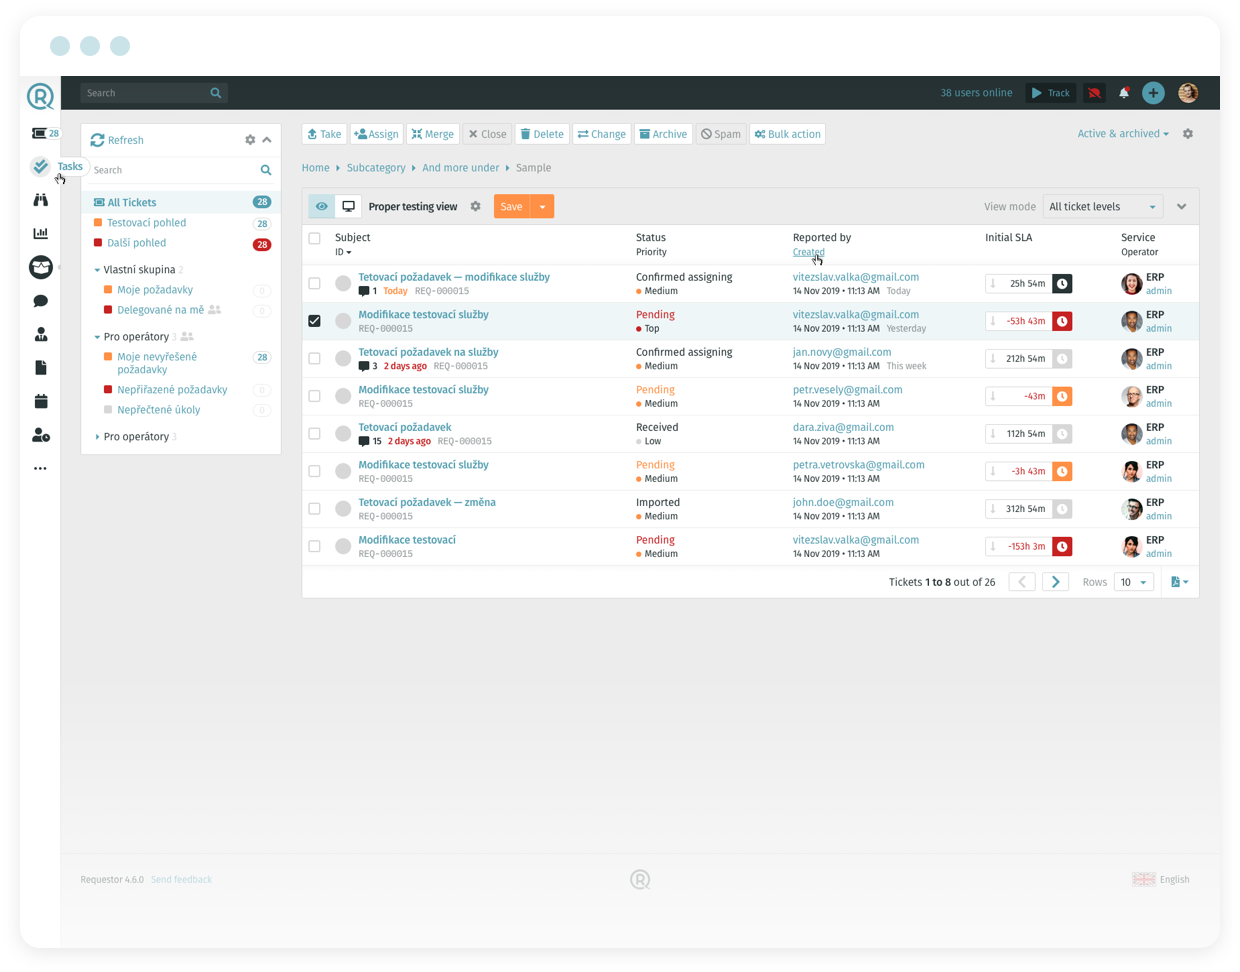
Requestor je přizpůsobivý helpdesk, s nímž obsloužíte zákaznickou podporu i interní požadavky svého týmu z e-mailu, telefonu i chatu. Snadno a na jednom místě.


Requestor má spoustu užitečných funkcí. A další na základě vašich potřeb neustále přidáváme.

V cloudu za 3 minuty, na serveru za 10 minut. V každém případě jej můžete začít používat ještě dnes.

Requestor zachytí vše – z e-mailu, telefonu i chatu – do jednotlivých tiketů pro jednoduchou a přehlednou komunikaci.

Ovládání Requestoru je tak snadné, že ho dostanete do ruky za hodinu nebo dvě. I pokud podobný systém vidíte poprvé v životě.

Requestor snadno propojíte s vaším CRM či ERP systémem, abyste mohli vše spravovat z jednoho místa.

V rámci měsíčních aktualizací do Requestoru přidáváme nové funkce a rozšíření. A vy je máte vždy hned k dispozici.
Vycházíme vstříc všem typům zákazníků, proto můžete pohodlně volit mezi hostovanou variantou a provozem na vlastním serveru. V obou verzích naleznete vždy kompletní funkcionalitu.
Requestor Cloud vás osvobodí od nutnosti instalace na váš server, aktualizací a zálohování. Místo toho se můžete plně soustředit na své podnikání.

Requestor On-Premises je ideální řešení pro společnosti s vlastní serverovou infrastrukturou a požadavkem na vysokou úroveň zabezpečení a integrace.